A Pragmatic Introduction to Knowledge Graphs
Audience: This blog is written for engineering leaders, architects, and decision-makers who want to understand what a knowledge graph is, when it makes sense, and when it doesn’t. It is not a deep technical dive, but a strategic overview. It meant to help you evaluate over hype.
I first encountered graph thinking in 2010 through an epilepsy research project. The work involved analyzing how certain types of epileptic seizures propagate through the brain in order to identify the epileptogenic zone (EZ), the region where seizures originate. It was important for us to be able to visualize the brain’s electrical activity as interconnected networks, highlighting how certain regions influence others during a seizure. This experience illuminated the power of graph-based models in capturing complex, dynamic relationships, reinforcing the idea that some problems are best understood through the lens of connectivity rather than isolated data points.
Fast forward 15 years, with the rise of large-scale AI, complex data integration challenges, and the growing popularity of knowledge graphs, the relevance of graph thinking has become impossible to ignore.
For decades, the popular way to represent data was to store them in tables, rows, and columns. Relational databases taught us to think in joins, foreign keys, and schemas. However, as our systems become more connected and our questions more complex, this rigid structure starts to strain.
We’ve seen this before, remember the shift from procedural programming to object-oriented (OO)? And then later the big move from OO to functional programming? Each shift required us to rethink how we model and reason about systems. This was not because one model was “better”, but because each revealed different kinds of complexity more clearly.
Knowledge graphs require a similar shift. They are not just another data format. They change how you see the problem.
Knowledge Graphs
If you’ve noticed the sidebar in Google Search results, you’ve seen a Knowledge Graph (KG).
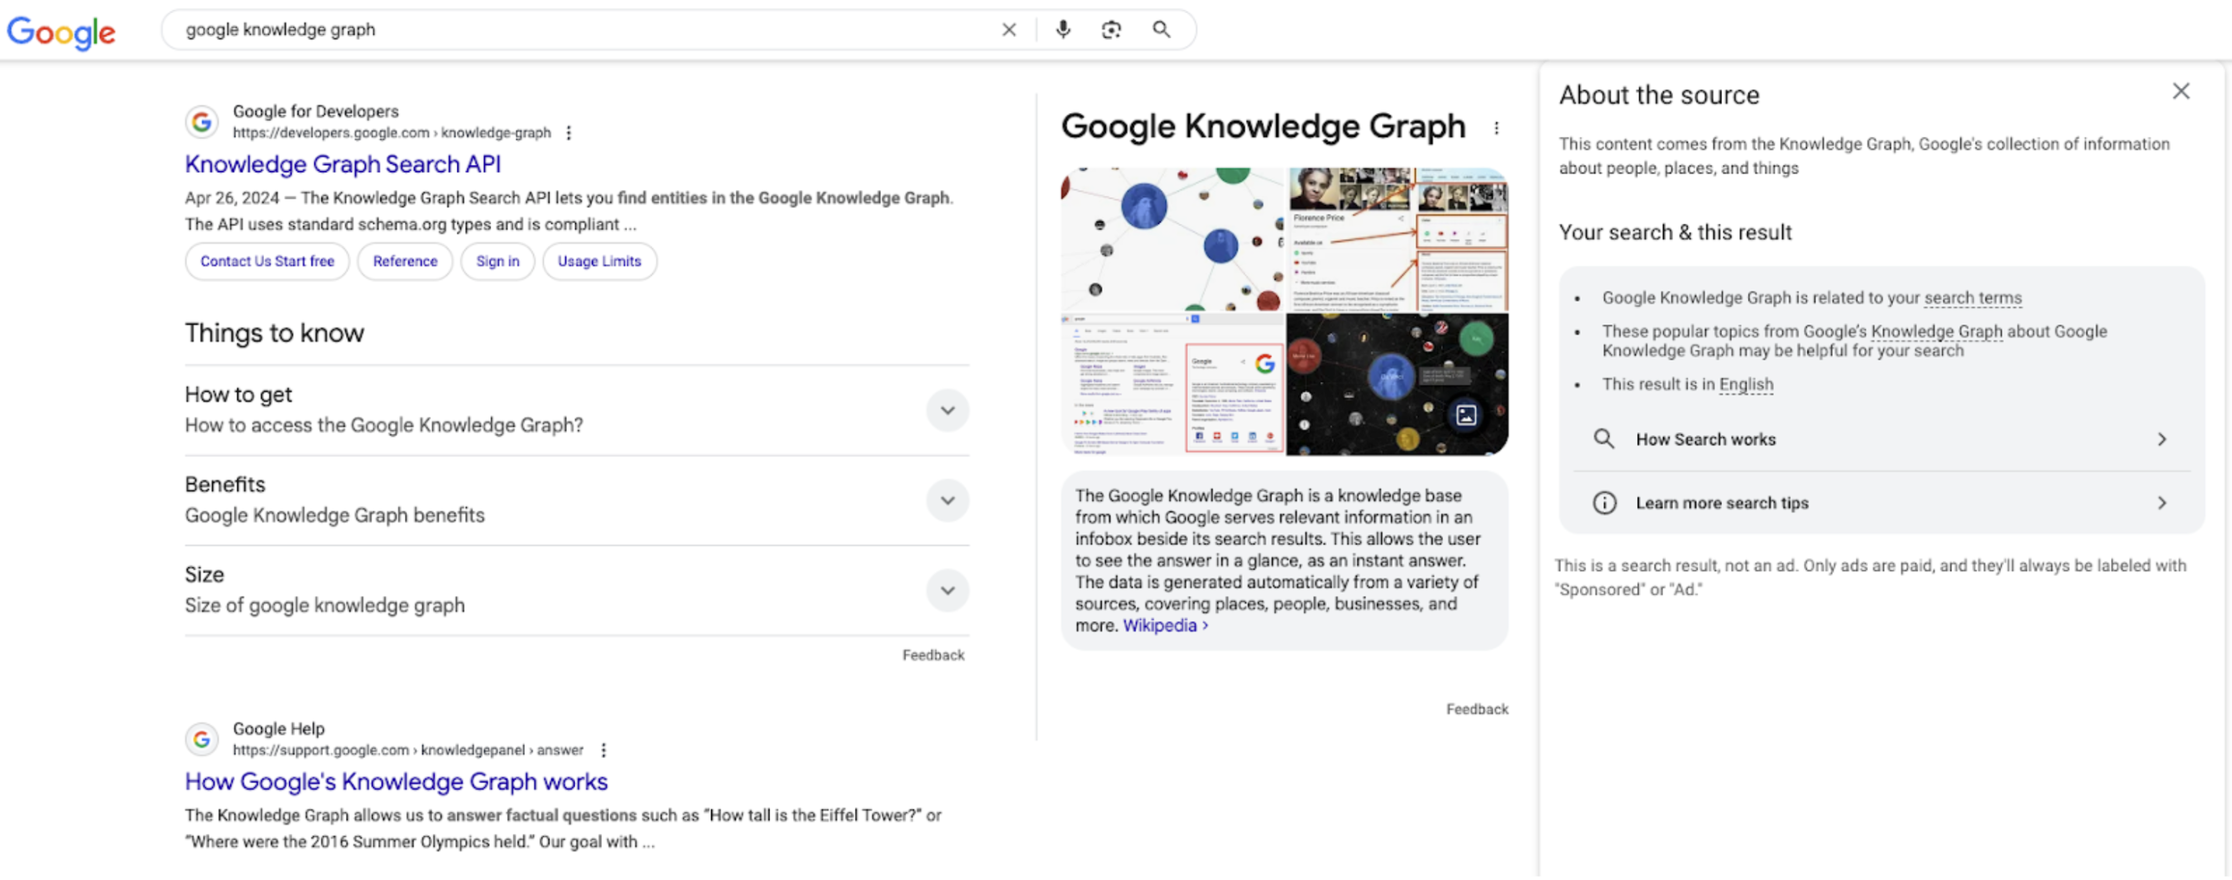
Google launched this feature in 2012 after it acquired Freebase. But more importantly, this shift reflected a fundamental change in how we think about information. Google doesn’t just think in strings, it thinks in things. When you search for “Einstein,” you are connected to the object itself, along with its relationships to physics, Nobel Prizes, and related concepts. Knowledge graphs make that possible.
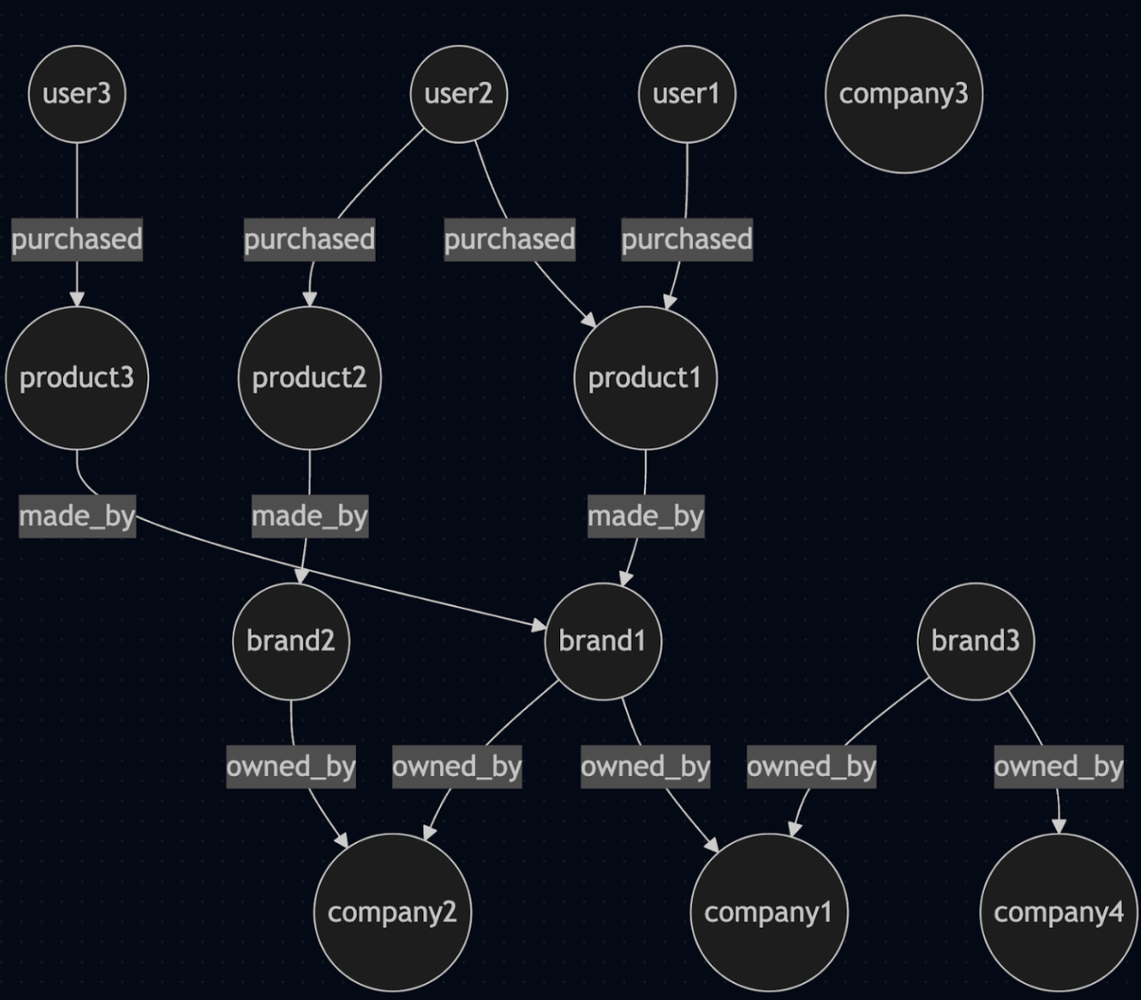
At its core, a knowledge graph organizes data around entities (e.g. users, products, devices) and the relationships between them (e.g. purchased, located_at, shares_with). Instead of isolating data into separate tables, it connects the dots directly. Think of it as a network of meaning, not just a database.
Basic Knowledge Graph Structure
purchased("user1", "product1")
made_by("product1", "brandA")
owned_by("brandA", "companyX")
It’s how your brain understands the world: not as rows in a spreadsheet, but as connected context. That’s the beauty of it, knowledge graphs make relationships explicit not just to engineers, but to product managers, data analysts, and executives alike. They turn implicit assumptions into navigable, inspectable models. It’s intuitive, just trace how entities relate. This is what makes knowledge graphs more natural when reasoning about relationships.
SQL vs KG Example
In traditional systems, you ask:
“Give me all transactions from users who used the same IP as someone with a chargeback.”
You write nested SQL joins across users, logins, devices, transactions, and chargebacks.
In a knowledge graph, you traverse the relationships directly. For simplicity, let’s use a different example, you want to find all the users who bought a product made by company1.
In SQL, you might write:
SELECT DISTINCT u.id
FROM USERS u
JOIN PURCHASES p ON u.id = p.user_id
JOIN PRODUCTS pr ON p.product_id = pr.id
JOIN BRANDS b ON pr.brand = b.id
JOIN BRAND_COMPANY bc ON b.id = bc.brand_id
WHERE bc.company_id = 1;  -- Assuming "company1" has ID = 1
The Knowledge Graph approach:
purchased(user, product),
made_by(product, brand),
owned_by(brand, company),
name(company, "Company1")
Instead of joining tables, you follow a path: User -> purchased -> product -> made_by -> brand -> owned_by -> “CompanyX”
When Knowledge Graphs Make Sense
Knowledge graphs aren’t a better database, they’re a better mental model when your domain is inherently relational. Here are some examples when they shine:
- Fraud rings must be detected by tracing devices, IPs or referral loops. Check this example on Fraud Detection if you are interested.
- Access control must consider hierarchy (e.g. managers of managers).
- Product recommendations depend on behavior across users and content.
- Data integration needs to unify messy, siloed systems.
- Ability to audit matters, and you need to explain “why” a rule triggered.
When It Doesn’t
Not everything needs a graph; for example if your data:
- Is flat, structured, and not deeply interrelated.
- Is mostly CRUD (e.g. inventory systems, blogs).
- Has no complex queries that span relationships.
- Will be managed by a team unfamiliar with declarative or graph-based thinking.
… then a graph will be overkill. Applying knowledge graphs to simple CRUD operations is over-engineering. The solution should match the problem. Don’t build a suspension bridge to cross a sidewalk.
Notes:
In the case that the team is not familiar with graph-based thinking, it’s important to recognize that adopting a knowledge graph approach may require a shift in mindset. Providing your team with the necessary training and resources can facilitate this transition and ensure successful implementation.
Timing also matters. There’s a cost to adopting a knowledge graph, whether in tooling, AI infrastructure, or team ramp-up. In some cases, the return on investment won’t show immediately. That doesn’t mean it’s the wrong decision - it might not be the right moment.
At some point, your application architecture will hit a ceiling. Whether you respond when that day arrives, or proactively prepare for it, is a strategic choice. Some organizations wait until they’re forced to modernize. Others invest early to get ahead of the complexity and scale more intelligently.
Good Practices
Model the question first. If you don’t know what you’ll ask, don’t model everything. Build incrementally. Start with a narrow slice of the domain and expand. Treat relationships as first-class citizens. Don’t force tables into edges. Use a semantic layer. Define an ontology that reflects your domain’s language.
Bad Practices
Trying to model everything as a graph upfront. Using graph tech just to say you did. Confusing flexibility with lack of structure. Ignoring performance of deep or recursive traversals at scale.
In Summary
Knowledge graphs are powerful when relationships are the problem. They help you ask better questions, model your domain in a more natural way, and make decisions with explainable reasoning. But they’re not for everything. Sometimes, a well-tuned index is all you need. Choose graphs when the relational complexity justifies it.
Need help evaluating whether your domain is graph-shaped? Ask: “Do my most important decisions depend on how things are connected?” If yes, it may be time to think of a graph.
Knowledge graphs are not just about better data modeling. They’re about elevating your data to knowledge, making your applications smarter and your decision-making intelligent.