In the previous article, I discussed the importance of VSM for digital products. In this article, I will show you an example of how to build a VSM for a simple trade alerting application. This is a highly abstract version of what my colleague and I did for one of our clients at Equal Experts. If you are in an organization or a team who has any of the following issues, you will also benefit from VSM:
- You don’t have clarity about your system’s dependencies; outages and quality issues seem to randomly and frequently occur that eventually get tracked to upstream teams and systems after long root-cause analysis cycles if the root cause is even found.
- You have difficulty introducing changes because you may introduce problems for other teams that “might” depend on you.
- You can’t upgrade versions of your service because you don’t have the means to track who’s using what version or what has changed since the previous version.
- Processing time is important, hence code changes are risky.
VSM doesn’t solve all your problems, but it does provide you with a map to understand your system better so that you can make better decisions. If you are on a similar journey, I hope you find this method useful.
For this article, I chose a trading platform as an example because timing plays an important role in trading, time is money, literally! Our alerting platform is very simple:
- Front-end Application: This is to enable the user to interact with the system
- Alert Service and API: The user creates an alert for a trading symbol
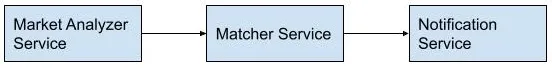
- Market Data Analyzer: We have a service that reads market data from 3rd party APIs and unifies them to be used
- Matcher Service: This is where all the magic happens, the algorithm goes through all active alerts and matches them against the incoming market data
- Notification Service: When there’s a match notification service sends an email to the user
Note: This is a very simple app, everything else regarding hardware and network engineering is out of scope for this example.
Currently, the latency between when the alertable market data enters the system and a notification gets fired is 100ms. 100ms is a long time and we want to improve the latency by at least 20% and bring it down to at most 80ms. In order to do this we need to understand where the time is spent between the Market Data Analyzer and Notification Service. Let’s get to work. The first and very high-level diagram will look something like this:
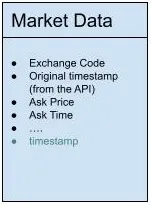
We need to understand how much time each service takes. We can track the time by adding a timestamp to the Market Data model. For example, a market data object will have the following fields, note we added timestamp as a new field:
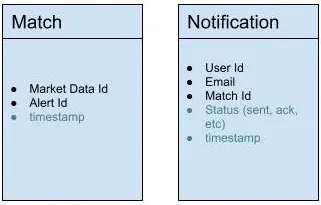
Similarly, we need to be able to track the timestamp for the Matcher Service and the Notification Service. In addition to the timestamp, we added the field Status to be notified if the send was successful or a failure:
Now you have valuable data to import into logs. Use visualization tools i.e. Datadog, Grafana, Prometheus, etc to observe the data at every stage of the process.
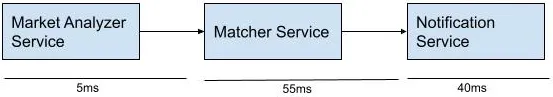
Without data, my first bet was to look into the Matcher Service since this is where most of the calculation is happening and very likely there will be places we can optimize in that service. However, looking at the high-level metrics I can see that something doesn’t look right in the Notification Service. A simple act of reading a message that just got published in the messaging bus, indicating that an alert has been triggered, and sending a notification out should be done in under 10 milliseconds. There are multiple places we can look into in the Notification Service, for example:
- How the data is being read
- What modifications are being done to the data before a message goes out
- Email service connection latency
- Etc
Improving Notification Service’s response time from 40ms down to 10ms will definitely satisfy the stakeholder’s request to bring down the latency from 100ms to 80ms. Looking deeper into the troubling service we find out the following information:
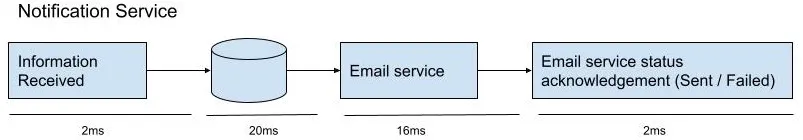
At this level we can see 2 areas for improvement:
- When an alert gets triggered, Notification Service persists the data in the database that takes an average of 20ms
- The email service provider connection takes an average of 16ms
Bring the findings to your team to discuss architecture decisions. Would your case be solved better with parallelism or change the order of the operations? Or could it be a hardware issue? It’s up to you and your team how to investigate more and how to solve this problem, but you have data to prove it and track if your solution is effective.
This was an example of how to find latency related waste in the system. But you can use VSM to find services or operations that do not need to exist, can be combined, etc. Now it’s your turn. Look into your digital product where you think waste might happen and draw a high-level VSM. Find out where is the best place to start introducing change to see the biggest bang for your buck!
- What are the inputs to the service?
- How do you consume the data?
- Put metrics around data consumption
- What changes are you making to the data?
- Put metrics around the algorithms or manipulation process
- What data do you produce?
- Put metrics around releasing or publishing the data
In the next article, I will look into how to use VSM and Wardley Mapping as two complementary tools together for your digital products.